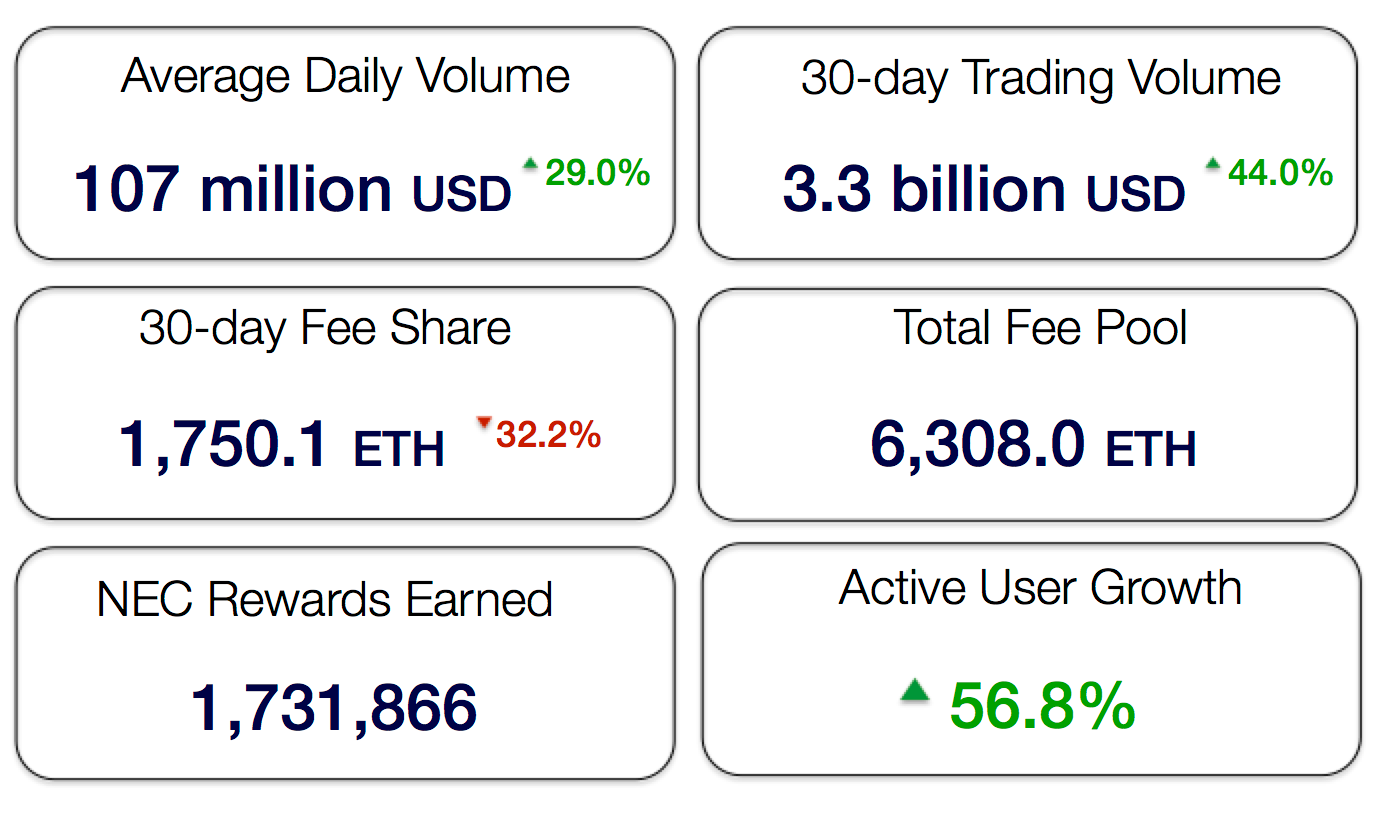
The third month of full operations finished on 14th May. Following the launch of the Ethfinex referral scheme, active users grew by 56.8% with a total trading volume of 3.3 billion USD throughout the month (up 44%).
Despite encouraging user and trading volume growth, overall revenues stayed roughly at parity with the previous 30 days. This was largely a result of the new fee schedule which is more generous to high volume traders. Although leading to lower revenues short term, this was a long term decision taken to further increase volume and reduce spreads, therefore making Ethfinex a more attractive venue for lower volume customers. This will particularly be important on the launch of Ethfinex’s decentralised trading portal aimed at retail customers.
This following report breaks down monthly trading revenues, volume and user growth, and will continue to provide more detailed statistics each period to our community of users.
Executive Summary
- Total fees of ~$2,560,000 (depending on price feeds) were collected through trading in the 30-day period.
- In line with this, 1,759.10 ETH have been contributed to the Nectar token contract, pledged to holders of NEC.
- 1,731,866 NEC tokens were issued to reward market makers active on Ethfinex in the past month.
- Statistics can now be viewed on nectar community.
- The credit of new tokens happened directly to trader’s Ethfinex accounts on the 14th May.
- The referral scheme went live, allowing users to initially earn 24% of the fees of any user they invite.
- The first community token listing vote began, as well as a new market for EVT (Ethfinex Voting Tokens). EVT are credited to Nectar token holders every 2 weeks and can be spent to vote on which new tokens should be listed on Ethfinex.
Month in Review — May
Revenue & Activity Reports
With an aim to provide as much transparency as possible to token holders, Ethfinex will provide detailed reports showing the results of each 30-day period.
1. Statistics
2. Trading fee revenues
All fees were converted as they were collected into ETH to provide an averaged conversion cost across the month and average out the effects of price volatility during the period.
Fee currencies in the table are ranked in order of most collected. Note — fees cannot be extrapolated directly to trading volume as users can set their preferred fee currency (hence the popularity of USDT and BTC).
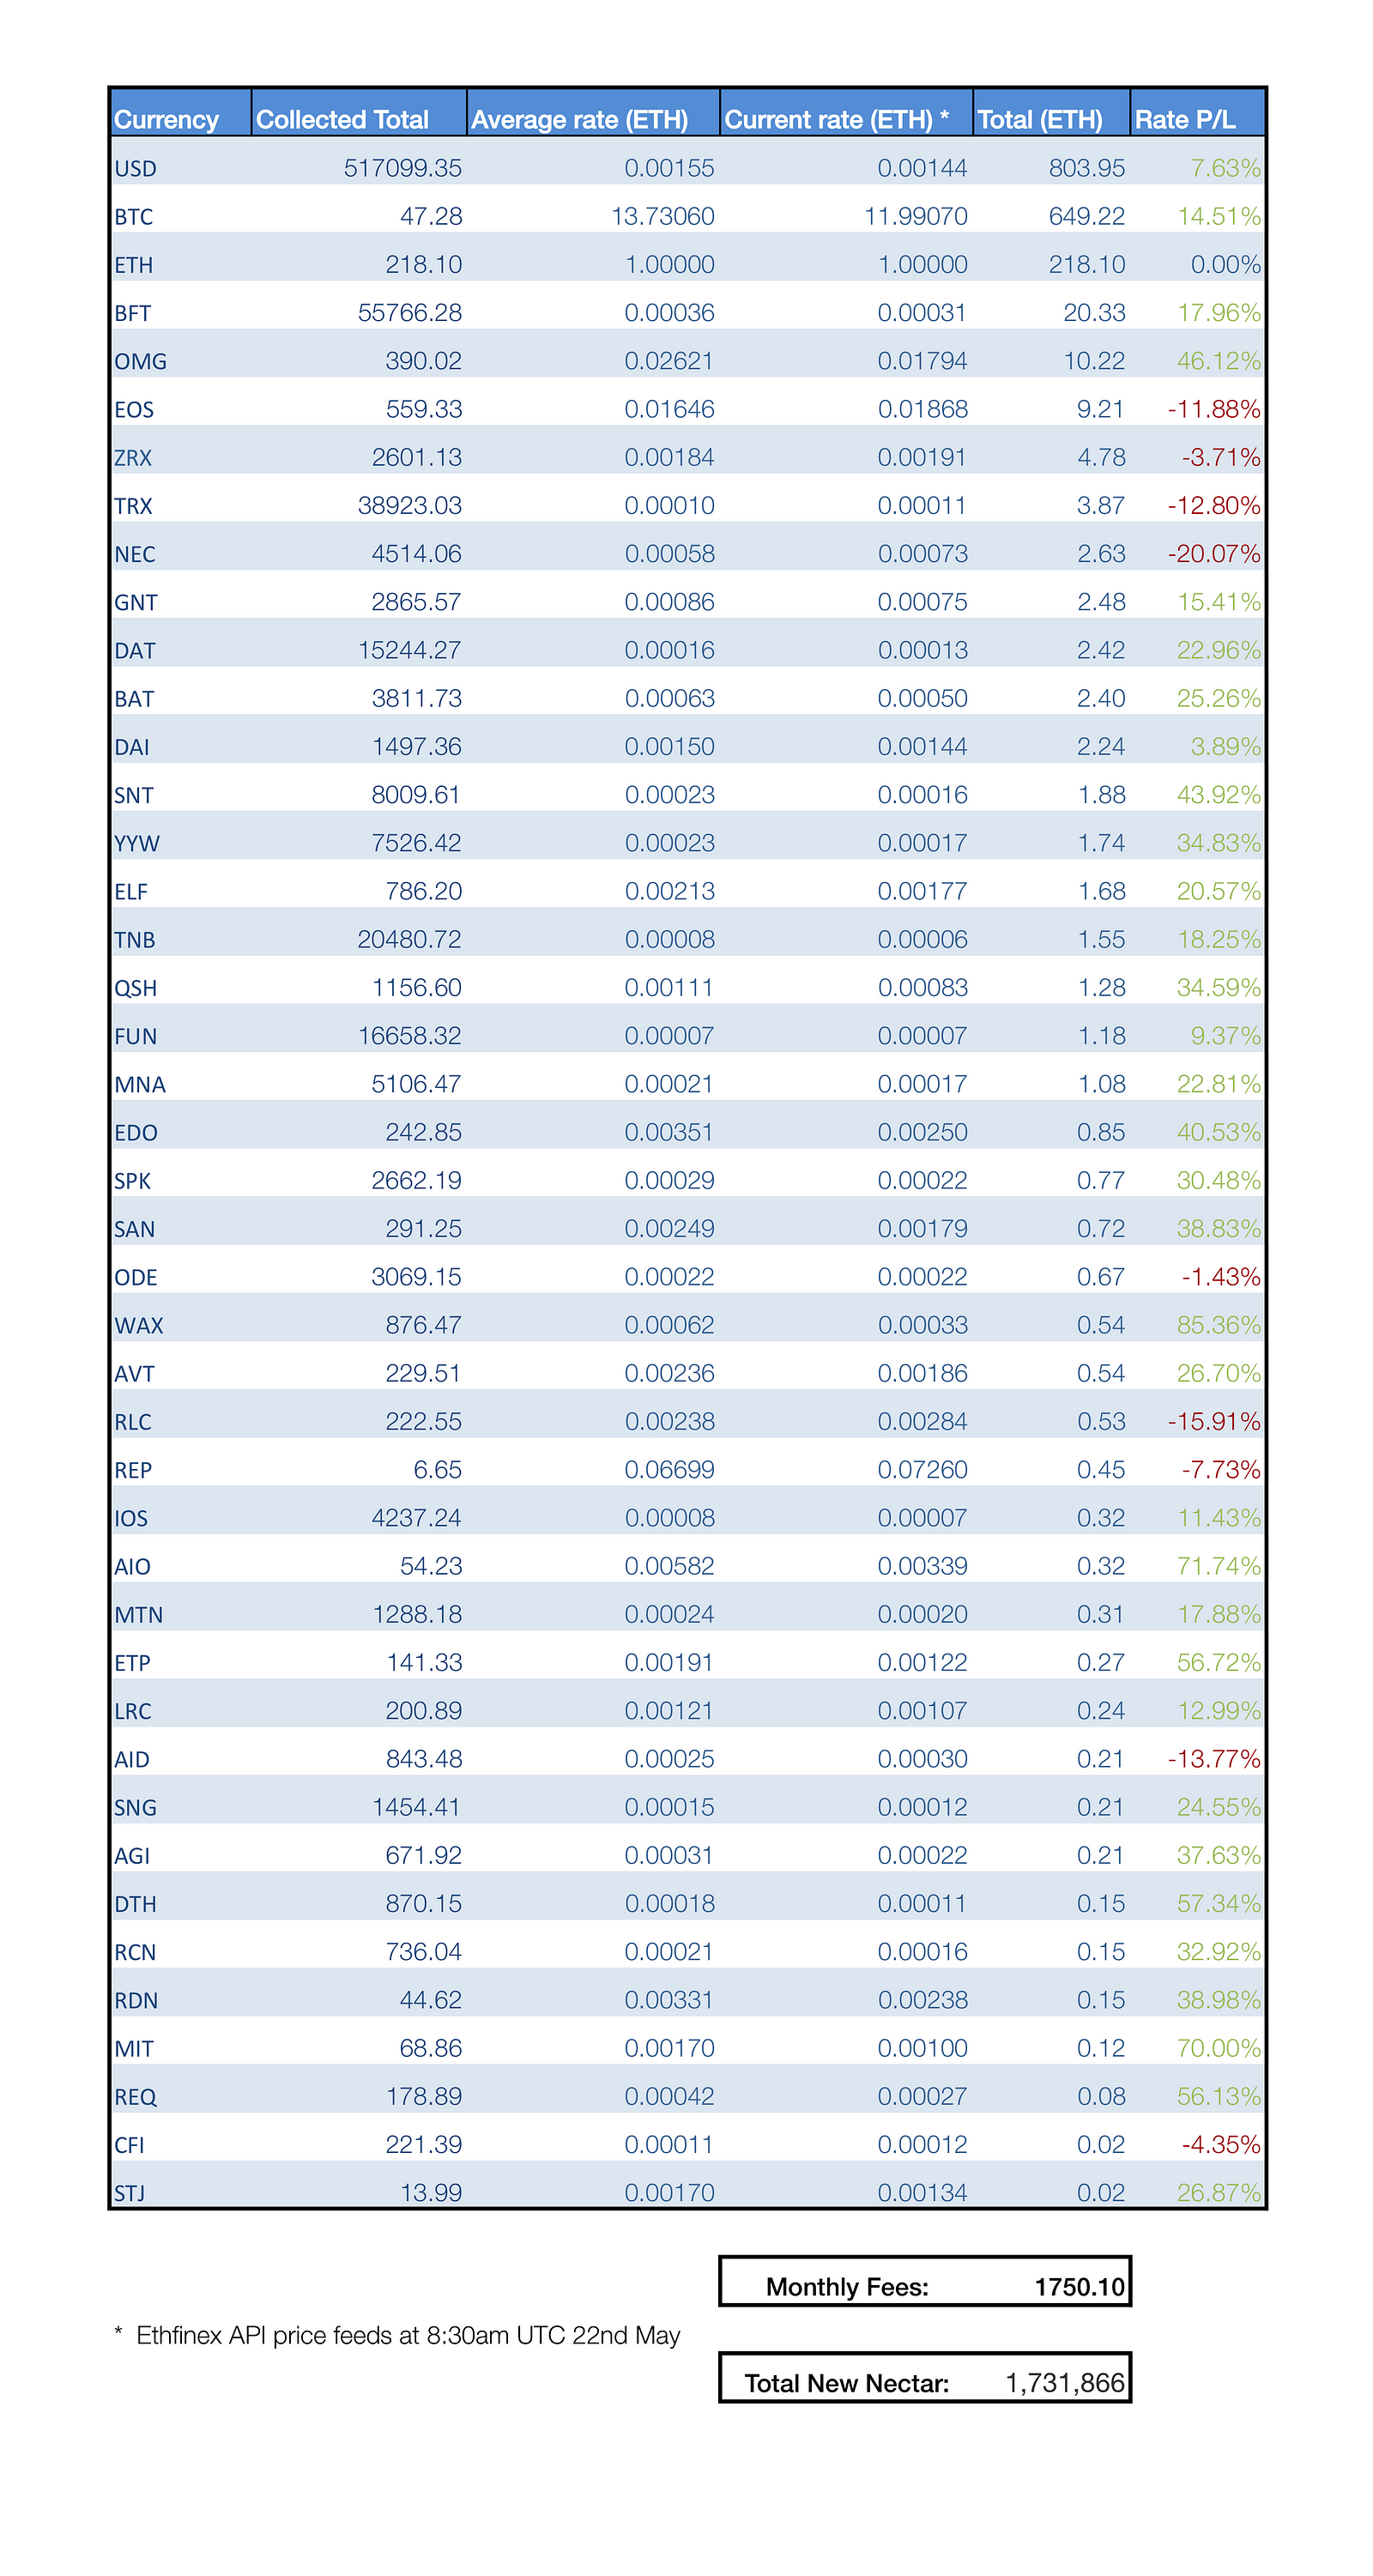
The above chart shows 50% of trading fees in all currencies collected. 1750.10 ETH was collected during the month and pledged to NEC token holders.
The USD value of the fees collected were roughly equal to those collected in the previous month; however, due to the rising value of Ethereum (in the range of 630–830 USD during the month) this lead to a reduction in the number of ETH committed to the smart contract.
The fee tiers were also adjusted at the start of this month, resulting in an increase in trading volume but short term parity in fee revenues. The aim of implementing these fee tiers was to increase volumes and incentivise tighter spreads on the order books. These low spreads should provide a better trading experience to smaller retail customers and should therefore generate higher fee revenues in the long term.BFT (BnkToTheFutureToken) continued to be one of the strongest recent additions, with poorer performance from many of the new tokens which gave very low fee revenues and volumes. This may be mitigated to some extent with newer listings through the use of the new community voting system to decide on new listings, giving a better indication of future trading volume.
Notably Storj, Cofound.it, Maker, Aragon, Kyber and Aion produced negligible trading fees, making the ‘long tail’ of low trading volumes painfully obvious.
3. Trading Volume
The total 30-day trading volume was 3.326 billion USD equivalent — an increase of 44% over the previous month. This may have been in part due to the fee reduction made at the top volume tiers which encouraged larger market makers to join Ethfinex.
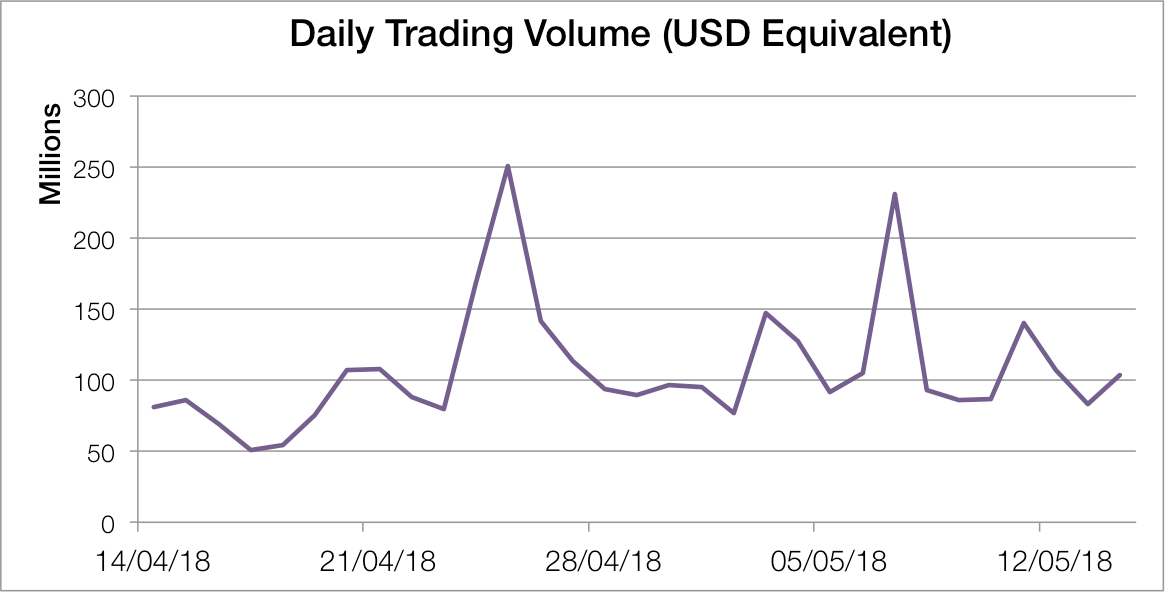
Peak daily trading volume was 251 million USD, with an average of 107 million USD. The majority of the volume resulted from the ETH/USD pair. Beneath two spikes, a slight upward trend-line across the month emerged.
4. Decreasing rate of NEC issuance
- Month 1: 1000 per ETH of fee revenue
- Month 2: 994 per ETH of fee revenue
- Month 3: 989 per ETH of fee revenue
- Month 4: 986 per ETH of fee revenue
The Month Ahead — June
Community Listing Votes
The first round of community token selections are currently happening. This is going to become a regular feature every 2 weeks, leading to a regular pipeline of listings. Visit nectar.community to vote today.
Decentralised trading & APIs
The decentralised trading portal and APIs are still the number one focus for Ethfinex this month. Our decentralised trading portal will allow for non-custodial, Ethereum-based trading via MetaMask, Ledger and Trezor hardware wallets, or Keystore file. This portal is currently going through UX review, but is set for launch shortly.
The Ethfinex gateway API will allow users to submit orders in the 0x format, subsequently allowing anyone to create their own UI (e.g. a ShapeShift style interface) to interact with the Ethfinex order books. All this can be done without creating an account, depositing funds or trusting Ethfinex.
