Monthly insights into the performance of Ethfinex
The fourth month of operations finished on 13th June. Following a dramatic crash in both market participation and asset prices across the entire crypto ecosystem, results this period were less encouraging than previous months.
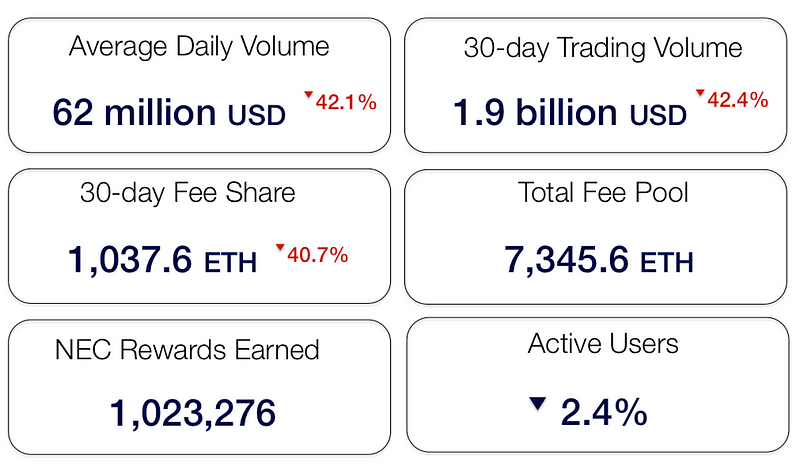
Active users (defined as the number of people who made at least one trade during last 30 days) did not grow for the first time, and Ethfinex total trading volume dropped to 1.9 billion USD for the month (down 42%).
This disappointing lack of user growth, even accounting for the overall market downtown, is a serious concern. New measures to address Ethfinex’s marketing strategy in preparation for the decentralised trading portal are now under way.
“Our marketing plan over the next few months will be anchored by two major events: the launch of the trustless trading portal, and a first of its kind event that will bring together the Ethfinex community. Building towards both events, we’ll be creating unique content that engages passionate advocates of the decentralisation movement and we’ll be unveiling exciting new content partnerships.” — Chris DeLuca, Marketing Manager
This following report breaks down monthly trading revenues, volume and user growth, and will continue to provide more detailed statistics each period to our community of users.
Executive Summary
- Total fees of ~$1,080,000 (depending on price feeds) were collected through trading in the 30-day period.
- In line with this, 1,037.60 ETH have been contributed to the Nectar token contract, pledged to holders of NEC.
- 1,023,276 NEC tokens were issued to reward market makers active on Ethfinex in the past month. Statistics can now be viewed on nectar community.
- The credit of new tokens happened directly to trader’s Ethfinex accounts on the 13th June.
The first two community token listing votes completed, as well as a new market for EVT (Ethfinex Voting Tokens). EVT are credited to Nectar token holders every 2 weeks and can be spent to vote on which new tokens should be listed on Ethfinex.
Month in Review — June
Revenue & Activity Reports
With an aim to provide as much transparency as possible to token holders, Ethfinex will provide detailed reports showing the results of each 30-day period.
1. Statistics
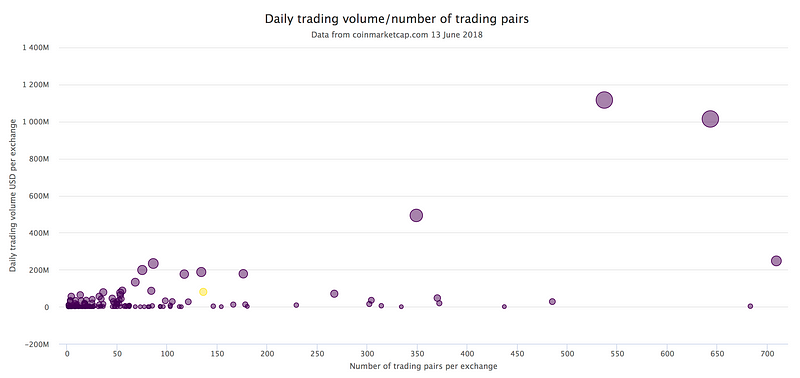
For comparison, this trading volume can be looked at next to other exchanges in the ecosystem. The two top right are Binance and OKEX. Ethfinex is marked in yellow. Ethfinex currently lies below the trend-line which shows a rough correlation between number of pairs and volume.
2. Trading fee revenues
All fees were converted as they were collected into ETH to provide an averaged conversion cost across the month and average out the effects of price volatility during the period.
Fee currencies in the table are ranked in order of most collected. Note — fees cannot be extrapolated directly to trading volume as users can set their preferred fee currency (hence the popularity of USDT and BTC).
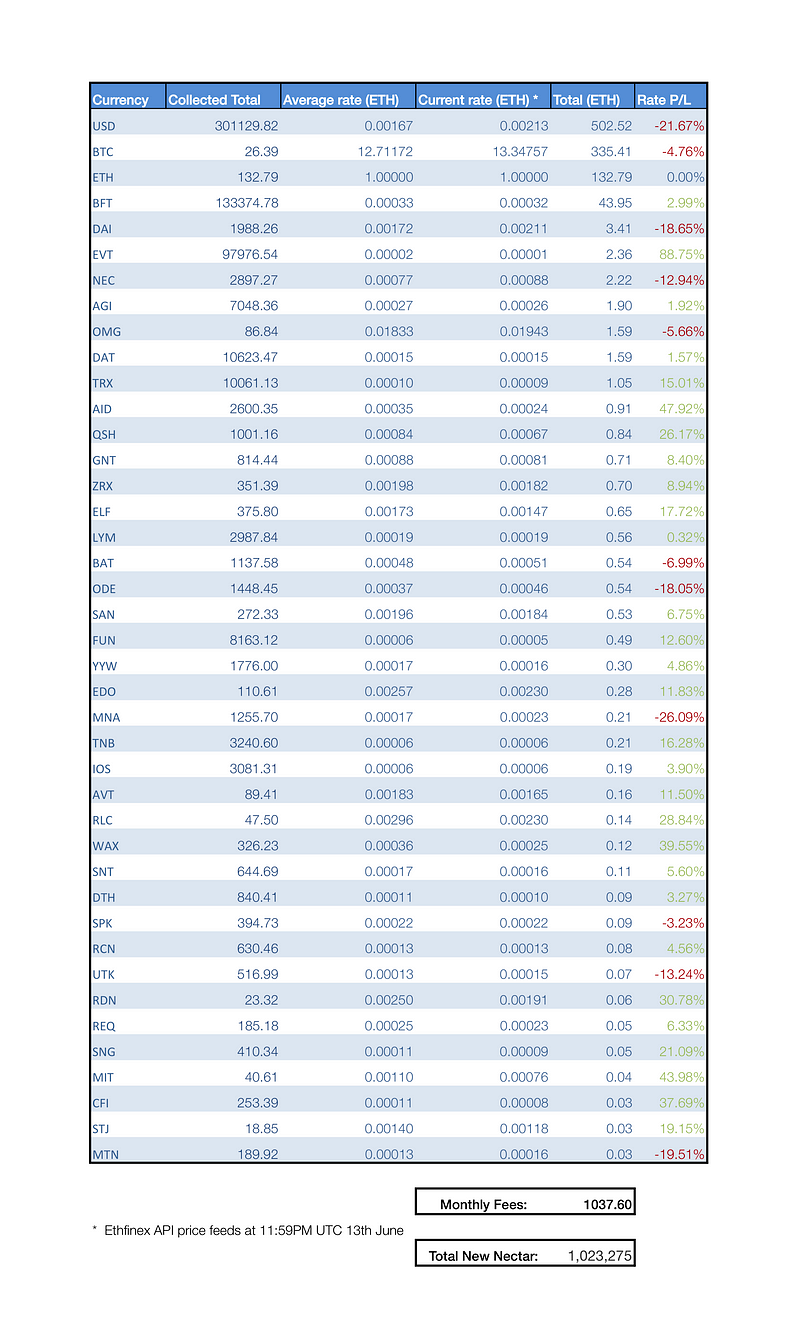
The above chart shows 50% of trading fees in all currencies collected. 1037.60 ETH was collected during the month and pledged to NEC token holders. DAI, and BFT pairs performed well.
Surprisingly EVT (Ethfinex Voting Token) became the 6th highest revenue earning token, with over a million dollars a day traded on several occasions.
3. Trading Volume
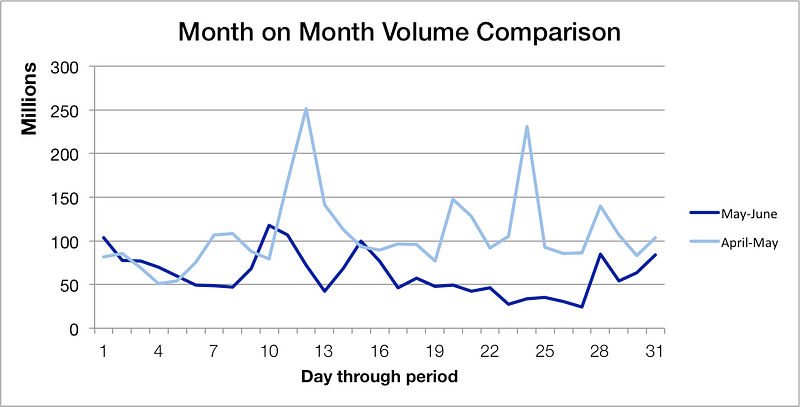
The total 30-day trading volume was 1.913 billion USD equivalent — a significant decrease compared with the previous month (3.3 billion). A downtrend can be seen across the period, and affected also every other exchange in the cryptocurrency ecosystem.
Whilst the decreasing trading volume is concerning, it is clear that we are in the midst of a bear market, and many traders are waiting to see how this will play out. Coupled with increasing regulatory uncertainty for the industry, we are prepared for the fact that we may see several more months of lower trading volume before new interest flows into the market.
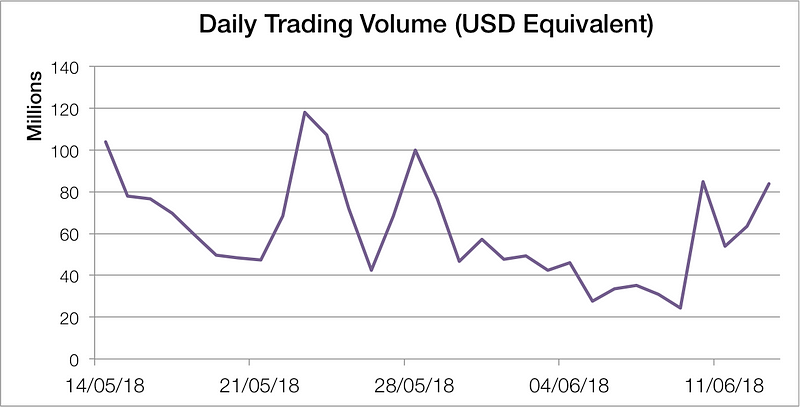
Peak daily trading volume was 118 million USD, with an average of 62 million USD. The majority of the volume continues to result from the ETH/USD pair.
4. Decreasing rate of NEC issuance
- Month 1: 1000 per ETH of fee revenue
- Month 2: 994 per ETH of fee revenue
- Month 3: 989 per ETH of fee revenue
- Month 4: 986 per ETH of fee revenue
- Month 5: 984 per ETH of fee revenue
The Month Ahead — July
Community Listing Vote Modifications
After completing two rounds of community votes last month we are now considering how we improve the process to encourage smaller users to participate. EVT airdrops to new sign-ups, fee discounts on new tokens for those who voted, and other forms of rewards for voters are all under consideration.
Although the current system has been successful in incentivising large traders to vote, the aim of the design should be to maximise participation from all on Ethfinex.Two more general votes also ended and passed by consensus. These were to list Cosmos Atoms Futures, and creating a trading pair for EURT against USDT.
Preview of the Ethfinex Trustless Portal (DEX)
The platform is now available to play around with, and if you would like to give early feedback and help with testing please email [email protected]. Any feedback on the UI would be welcomed as we continue to refine it up until launch.
Upcoming Hackathon
In order to encourage users to play with the new APIs and innovate on Ethereum, we are sponsoring the Bitfinex Hackathon with a prize worth 5000 USD worth of NEC!We would love to see as many of you as possible in London on the 20th-22nd July for the chance to learn about exchange technology and Ethereum, and possibly a chance to join our team as a developer.